Using the Kinect to Assess Involuntary Motion at Health 2.0

This past weekend I participated in a Health 2.0 developer challenge in Boston. The event was a one day hack-a-thon hosted by Health 2.0 and O’Reilly at a Microsoft building in Cambridge. I was invited to give a brief presentation about using the Kinect for motion tracking and then to help out any groups that wanted to use the Kinect in their project. At the end of the day, the projects were judged by a panel of experts and a group was named the winner.

More about the competition in a minute, but first here were the slides from my presentation:

I concluded the presentation by demonstrating the skeleton tracking application I blogged about recently.

After the presentations, the participants self-assembled into groups. One of the groups was talking about trying to build an early warning system for seizures. They asked me to talk to them about using the Kinect in their project. Unfortunately, the application seemed difficult to impossible with the Kinect. If you pointed a Kinect at a person at their desk all day long, how would you differentiate a seizure from a routine event like them dropping their pen and suddenly bending down to pick it up.

We had a brief discussion about the limitations and capabilities of the Kinect and they pondered the possibilities. After some brainstorming, the group ended up talking to a fellow conference participant who is doctoral candidate in psychiatry and works in a clinic, Dan Karlin. Dan explained to us that there are neuromuscular diseases that lead to involuntary muscle motion. These diseases include Parkinson’s but also many which occur as the side effects from psychiatric drugs.

Dan told us about a standard test for evaluating these kinds of involuntary motion: the Abnormal Involuntary Motion Scale (AIMS). To conduct an AIMS exam, the patient is instructed to sit down with his hands between his knees and stay as still as possible. The doctor then observes the patient’s involuntary motions. The amount and type of motion (particularly whether or not it is symmetrical) can then act as a tracking indicator for the progression of various neuromuscular disorders.

In practice, this test is underperformed. For many patients on psychiatric drugs, their doctors are supposed to perform the test at every meeting , but many doctors do not do so and even for those who do, the normal long delays between patient visits makes the data gathered from these tests of limited utility.

Doctor Dan (as we’d begun calling him by this point) said that an automated test that the patient could perform at home would be a great improvement to doctors’ abilities to track the progression of these kinds of diseases, potentially leading to better drug choices and the avoidance of advanced permanent debilitating side effects.

On hearing this idea, I thought it would make a perfect application for the Kinect. The AIMS test involves a patient sitting in a known posture. Scoring it only requires tracking the movement of four joints in space (the knees and the hands). The basic idea is extremely simple: add up the amount of total motion those four joints make in all three dimensions and then score that total against a pre-computed expectation or a weighted-average of the patients’ prior scores. To me, having already gotten started with the Kinect skeleton tracking data, it seemed like a perfect amount of work to achieve in a single day: record the movement of the four joints over a fixed amount of time, display the results.

So we set out to build it. I joined the team and we split into two groups. Johnny Hujol and I worked on the Processing sketch, Claus Becker and Greg Kust worked on the presentation, and Doctor Dan consulted with both teams.

A few hours later and we had a working prototype. Our app tracked the joints for ten seconds, displayed a score to the user along with a progress bar, and graded the score red, yellow, or green, based on constant values determined in testing by Doctor Dan.

Here’s a look at the app running with me demonstrating the amount of motion necessary to achieve a yellow score:

Here’s an example of a more dramatic tremor, which pushes the score into red:

And a “normal” or steady example is here: Triangle Tremor Assesment Score Green

The UI is obviously very primitive, but the application was enough to prove the soundness of the idea of using the Kinect to automate this kind of psychiatric test. You can see the code for this app here: tremor_assessment.pde.

Here’s the presentation we gave at the end of the day for the judges. It explains the medical details a lot better than I have in this post

And, lo and behold, we won the competition! Our group will continue to develop the app going forward and will travel to San Diego in March to present at Health 2.0’s Spring conference.

I found this whole experience to be extremely inspiring. I met enthusiastic domain experts who knew about an important problem I’d never heard of that was a great match for a new technology I’d just learned how to use. They knew just how to take what the technology could do and shape it into something that could really make a difference. They have energy and enthusiasm for advancing the project and making it real.

For my part, I was able to use the new skills I’ve acquired at ITP to shape the design goals of the project into something that could be achieved with the resources available. I was able to quickly iterate from a barely-there prototype to something that really addressed the problem at hand with very few detours into unnecessary technical dead ends. I was able to work closely with a group of people with radically different levels of technical expertise but deep experience in their own domains in order to build something together that none of us could have made alone.

I’ll post more details about the project as it progresses and as we prepare for Health 2.0.

Posted in kinect | Leave a comment

On the Launch of the Computer History Museum

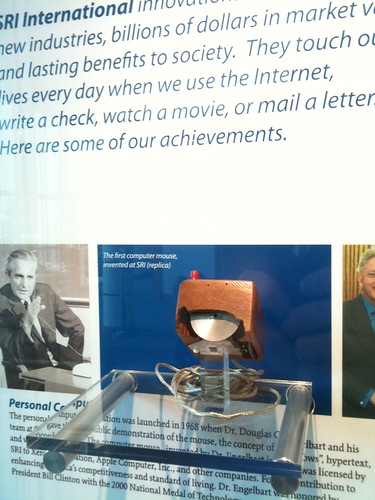
This past January, I was lucky enough to travel to San Francisco to conduct a round of research related to my thesis. The core of the trip was a meeting with Christina Engelbart, Doug Engelbart’s daughter and the co-founder and Executive Director of the Doug Engelbart Institure, the main organization actively working to advance Engelbart’s vision of using digital technology to enhance collective intelligence and a chief upholder of the Augment legacy.

I was put in touch with Christina by Nancy Hechinger, my thesis advisor. With just a brief phone conversation for introduction, Christina was extraordinarily generous with her time. She arranged a meeting for me with Henry Lowood, the curator for History of Science and Technology Collections and Film and Media Collections in the Stanford University Libraries, which has Engelbart’s papers as well as those of many other computer pioneers. She gave me a tour of 333 Ravenswood, the headquarters of SRI, where Engelbart’s Augmentation Research Center had its headquarters when it performed its pioneering work and where the DEI still has its offices today. And last, but definitely not least, she took me along to the grand opening of the Computer History Museum at which she briefly introduced me to her father, which was quite a thrill.

SRI original mouse

In addition to being a surpassingly gracious guide, Christina was also an incredibly articulate spokesperson for the Augment legacy. Talking with her throughout the day greatly deepened my knowledge of the philosophy underlying Engelbart’s intricate and holistic technosocial system.

In some ways, the single most useful part of the trip — at least for advancing my own thinking about my thesis work — was the Computer History Museum itself. Both its successes and its flaws spoke volumes about how best to present this material: what’s most aesthetically interesting about it and what is most easily lost in a traditional museum approach. I’ll spend the rest of this post trying to articulate these successes and failures in a kind of mini-review of the the Museum with a particular eye towards the lessons it might hold for my project.

Even though the museum has been open in different capacities for years, the unveiling of its current show, Revolution: The First 2000 Years of Computing, inaugurates a new era in its history. This installation is more than a single show. It occupies most of the Museum’s permanent installation space and uses all of the most impressive physical materials from its collection. It also encapsulates the museum’s twin curatorial preoccupations: presenting the physicality of computer technology and breaking up the linear progression of technology into thematic interpretive units. For me, the first two of these ambitions came off much more successfully than the second one.

In contemporary life, computer technology seems to have bifurcated into sensuous products and ineffable information. On the one hand we have iPhones and iPads that get described as “lickable” and become foci for almost orgiastic displays of communal commercial lust. On the other we have “architectures of participation” and social networks that encourage subtle but pervasive transformations in our interrelations. The Computer History Museum does a brilliant job telling the pre-history of the physical charisma currently achieved by technology. Where it fails is in trying to get at the intangible side of this same history: how the networks of people and ideas, the social networks and architectures of influence amongst researchers and engineers, lead to technology that the very structure of our world.

The Computer History Museum shows just how charismatic computer hardware can be. Its exhibits are all based around old machines, machines whose physical presence speaks volumes about the worlds their designers imagined.

Take as a case-in-point the museum’s presentation of SAGE, a US military project for tracking and intercepting Soviet aircraft. SAGE was massively expensive, costing more than the Manhattan Project. The Museum has a series of SAGE terminals as well as this stunning model of the entire SAGE complex that was built as part of its design process:

Every exhibit centers around the physical display of some particular hardware system. The design aesthetics of these systems change and evolve over time, almost like works of sculpture arranged to demonstrate the evolution of some particular style or school.

The Atanasoff-Berry Computer, circa 1942.

An IBM mainframe from the early 60s.

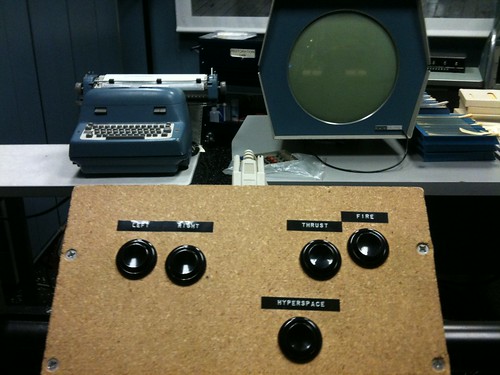
Further, the Museum actually works to restore some of its hardware to working order, like its the PDP-1 in a prominent place near off the main lobby which has been lovingly repaired and even retrofitted with new controls so visitors can play Space War on it themselves.

PDP-1 with Spacewar

This use of the hardware serves to defamiliarize computing’s past, reminding us that older computers were not just primitive ancestors of today’s sophisticated machines, but that they actually embodied different social arrangements, different ideas of what technology could be and how it could shape and enhance our lives, even different ideas of what made machines beautiful.

The Computer History Museum’s organizational strategy, on the other hand, is not nearly as effective. Eschewing the obvious linear historical narrative, the Museum opts instead for a series of thematic clusterings: Mastering the Game, Networking and the Web, Input/Output, etc. While the goal of transcending a naive progress narrative is admirable, the result of this particular way of cutting up the apple is to render any sense of historical context or interrelation invisible.

Computing is, maybe more than any other technosocial enterprise, interdisciplinary. Its history cannot be told without touching on government bureaucrats who provided funding, labs that built integrative hardware-software systems, artists who took up cutting edge tools to pursue ancient aesthetic ends, hippies and revolutionaries who fastened on and transformed tools originally invented for military ends.

By splitting up the history of computation into these thematic clusters, the museum renders invisible the figures and movements whose approach was broadest. Figures like JCR Licklider and Bob Taylor at ARPA, whose broad-minded funding strategy profoundly shaped computer research in this country through its most important landmarks in the 60s, their immense contributions nearly disappear when split up in this way.

Similarly, revolutionary researchers like Doug Engelbart and John McCarthy, whose work touched many of the museum’s separate themes — they built input/output devices, they participated in the early stages of ARPAnet, etc. — and who did so out of their own integral visions for what computing could be and mean, their work disappears into a series of brief mentions in isolate exhibits. The actual core of their vision, of Engelbart’s vision of collective intelligence enhancement and bootstrapping, of McCarthy’s vision of Artificial Intelligence, is simply never presented in this schema.

Strangely, the system that best survives the dislocating effect of this curatorial approach is Nolan Bushnell’s Atari. Somehow games are presented as always already integral systems. Or, put another way, they’re not thought of as systems at all, not the sum of a mouse and a networking interface and a display, but unified entertainments that are mostly examined for their pop cultural influence.

While I may be offering criticisms here, I don’t in any way mean to condemn the museum’s work. Even as it stands now, the museum is an impressive achievement. The task being asked of it, to propose a full interpretation a technology which transformed human culture and material life in less than 50 years, is awesome in its scope and ambition. Obviously any initial organization or presentation strategy would necessarily be a first draft of history, to be refined and improved as time goes on and historians emerge with interpretive regimes of greater sophistication that those that currently exist.

As was in impressive evidence the night of the gala opening, while it iss aging, the founding generation of the computer revolution is still very much alive, present, and involved in the creation of this museum. To have already found a fully effective historical perspective in this context would be astonishing.

At this point it must be enough to begin the process: to gather the physical objects, closely observe them, put them near each other, and bring the people together, to see what happens.

History will show up eventually.

Posted in thesis | Leave a comment

Skeleton Tracking with Kinect and Processing

Ever since PrimeSense open sourced the Kinect middleware, it’s been clear that body tracking interfaces were going to rapidly come within reach of hobbyists and artists.

PrimeSense demo video of skeleton tracking with the Kinect and their OpenNI middleware

The PrimeSense middleware takes the depth data coming from the Kinect camera and performs a process called “skeletonization”. It detects individual users who are within view of the camera and then tracks the positions of their bodies. All of a sudden, as a programmer, rather than having access to the pixels of a flat image, or even the depth information from the raw Kinect data, you now have a description of your users as a series of joints in space. For many applications, especially gesture-based interfaces and motion capture, this is exactly the data you need to get started.

Unfortunately, when the PrimeSense middleware was released the software reference implementation that went along with it was Windows only. Slowly but surely since then, this situation has improved. PrimeSense has released packages for Linux and OSX and the open source community has started to work towards integrating them into more accessible environments like Processing and Open Frameworks. This process is not yet complete, but it has gotten to the point where and adventurous person can get started. This post documents my first successes doing just that.

The first step is getting all of the dependencies installed. A bit of a challenge at this point, but possible. (Note: this post is based on my experiences of doing this on OS X and will be specific to that.) Tohm Judson’s OpenNI to Max/MSP via OSC tutorial is the best place to start. If you have never installed MacPorts before his directions will go rather smoothly (though there are a lot of steps). If you are unfortunate enough to have installed MacPorts before upgrading to Snow Leopard, you’re in for a bit of a struggle as the MacPorts automatic upgrade path seems to have gotten badly broken with that change. After much frustration I managed to uninstall all the ports that were affected by the upgrade problem (the MacPorts migration page is a good place to start if you’re in a similar situation) and then proceeded through the rest of the steps outlined in Judson’s tutorial.

Judson’s tutorial is based around OSCeleton, a proxy that broadcasts the skeleton data from the Kinect middleware as OSC messages. OSC is a standard format for real time messaging similar to midi and is supported in many languages and platforms, including Processing and Open Frameworks. Once you’ve successfully gotten to the end of Judson’s tutorial, you’ll have OSC messages representing the skeleton data being transmitted and then you can start writing your own code that receives those messages and does whatever you want with the information.

Once I’d gotten everything successfully installed, I ran the OSCeleton Stickmanetic example just to make sure things were working:

This sketch simply uses the skeleton position information in 2D as an obstacle to some particles falling out of the sky with Box 2D for physics. It’s relatively silly, especially the choice of connecting the shoulder joints directly to the head rather than to the neck as seems a lot more intuitive, but it did prove to me that everything was installed and working successfully.

Then, as a basis for my own code I started with the OSCeleton Processing MotionCapture3D example. This is a Processing sketch that reads the incoming OSC messages from OSCeleton, converts them into points in 3D space representing each of the joints of the body and draws a series of spheres at those points.

I wanted to also add lines between each of the joints so, after some experimentation, I used Processing’s beginShape() function and treated each adjacent pair of joints as vertices for lines. In working through this exercise I constructed the following map of how OSCeleton names each joint:

Obviously, I’m only going into detail on the right side of the body, but equivalent nodes are available for the left arm and leg as well. In addition, it’s worth noting that for whatever reason I wasn’t actually seeing any collar, finger, or ankle joints. I don’t know what causes these to not come across, but in my setup they were not appearing in the OSC messages sent by OSCeleton.

Once I’d successfully finished drawing the vertices, I tried my sketch out with my roommate. Lo and behold, you can track two completely separate users no problem.

A couple of notes about this video. Its sluggishness was caused by the screen capture software I used to record it, not the code itself. When not recording, it ran smoothly at a much higher frame rate on my machine. Also, many of the glitches here are caused by the constrained space of my room. The Kinect can obviously only process the parts of your body that it can see. My room is cramped enough that the two of us could barely fit within the Kinect’s field of view simultaneously. Some of the weird glitches you’re seeing here are when individual joints disappear from view and my code draws them as if they were at the top left corner of the screen.

But now that I’ve gotten the skeleton data into a form that I can use, what to do with it? The first thing I thought of was to use it to change the view of this skeleton itself. After all, even though I’m gathering this data in 3D, you’d barely know it from the display you’re seeing here. And most 3D browsing interfaces are incredibly unintuitive and hard to learn, maybe that’s an area of design where full-body gestures could actually be useful.

I added the Obsessive Camera Direction library to my Processing sketch. OCD is the best Processing camera library I know for intuitive control of the viewport. It has slightly more controls than the commonly used PeasyCam, but is less surprising in my experience.

After I had OCD installed, I configured it to always aim at the joint representing the right hand of the detected figure. Then I calculated the distance between the right and left hand and made it so that controlled the zoom. Moving your hands closer together would cause the camera to zoom in, moving them further apart would zoom out. Finally I made it so that raising both hands above your head would rotate the camera around the figure and moving both hands below the hips would rotate the camera around the opposite way.

Here’s what it looked like when I started playing with it:

The code for this is available here: controlling a 3d camera via gestures with kinect in Processing. This video is dramatically improved from the one above because, in the interim, I discovered MovieMaker, a built-in class that makes it incredibly easy to record movie files of a sketch from directly within Processing.

A next obvious experiment to conduct along this path would be to use this interface to navigate around more interesting 3D data, like a pre-existing 3D model. It would be especially cool to use your head to determine the location and angle of a camera within a 3D space to provide navigation and recording of a virtual environment. And then to use the position of your hands to fast forward or rewind various 3D motions being played back within the virtuality.

Another interesting area that I plan to explore soon is creating 3D “hot spots” for interfaces. In other words, mapping particular parts of 3D space to various application controls that can then be triggered by moving different parts of your body into them. Matching these hot spots to actual physical objects or locations within a real room is particularly interesting. Imagine: bringing your left hand near the top of your bookcase turns on a light, putting your right hand there turns it back off, etc. The possibilities are endless.

Posted in thesis, Video Sculpture | 18 Comments

Night Flight: a miniature light sculpture cityscape using fiber optics

Flying over a dense city at night is a singly modern experience. The confusions and dislocations of street level life flatten into schematic clarity; the electric glow gives the terrain the sci-fi feeling of electronic circuitry; the unlit natural areas, — parks, rivers, bodies of water — disappear into invisible black pools of absence. All of it is far distant below you, beautifully complex and detailed, but simultaneously seemingly laid out specifically for your comprehension.

Recently, Allison Eve Zell and I set out to build a light sculpture that would reproduce some of these qualities.

We started by acquiring fiber optic lights from a local lighting store. These are glass or plastic fibers that transmit light from one of their ends to the other. Hence, when attached in a bundle to a strong light source at one end, the fibers can produce a series of tiny intense points of light, the perfect thing for emulating a night time cityscape.

One of the inspirations for trying this technique was my knowledge of fiber optics having been using in miniature shots for Blade Runner. In fact, I recently saw one of the actual miniatures used in that film at the Museum of the Moving Image, albeit without the fiber optics turned on:

Blade Runner miniature fiber optics

This youtube video: Mark Stetson Blade Runner Tyrell Pyramid (embedding disabled) shows some behind the scenes footage of the making of these miniatures and the Blade Runner DVDs have great a documentary on the subject.

After some experimentation with these and a small halogen light, we started working on shaping the fibers into the city grid. We downloaded and printed out a map of lower Manhattan to act as a guide.

We decided to focus on a slice of the city around the lower edge of Central Park, including both rivers, and parts of New Jersey and Brooklyn. We attached the map to a piece of black construction paper and proceeded to punch holes along the streets and buildings anywhere we wanted to place a light.

Punched midtown holes

Once this was in place, I built a wooden box to hold the map in a fixed position above the lights so we could mount the fibers and thread them through the holes. We mounted a piece of translucent orange material over one of the bundles of fiber so that some of the lights would have that signature orange quality of street lights in Manhattan. Then we spent a couple of days in the painstaking hand work of putting individual fiber optic strands through tiny pin prick holes.

Side view of inside of sculpture with fibers installed

Once these were all installed, I gave the fibers a kind of a haircut: chopping them down to size so they’d actually float close above the black cardboard like building and street lights.

At this stage, all that remained was to install a mirror within the box and to close up the box with black foam core so that the viewer would see it through a peephole. The mirror acted to increase the illusion of depth within the box, to make it so we could control the angle and framing of the lights, and to echo the round shape of an airplane window. In addition to the obvious necessity of keeping the box dark, forcing the viewer to see it through a peephole had the additional effect of helping to transport you to another perspective. With your eye pressed up against the small hole, it really felt like you were suddenly a few thousand feet up, getting ready to descend towards one of the area airports. In the critique, one of our classmates even suggested we should add the smell of stale coffee and carpet to complete the effect.

The final piece is very hard to document, but here’s a photograph that will give you an idea of what it looked like through the peephole:

Night Flight

Posted in Art, Video Sculpture | Leave a comment

Treatment and design for a Nullsleep video using the Kinect

Last fall when the Kinect first launched Jeremiah Johnson and I immediately started talking about how much sense it made to use it to make a video for him. Jeremiah records and performs as Nullsleep. His music is typically characterized as 8-bit (since he has a tendency to perform with Gameboys on stage), but, more broadly, his musical goal is to push technology beyond what it’s meant to do to the point where it breaks, producing interesting results and textures. Hence the complex, but also frequently quite glitchy, aesthetic of the images being produced in some of the early Kinect demo videos seemed like a perfect fit.

And from my point of view, obsessed with special effects and trying to figure out how to deploy them as an artistic medium, the prospect of making a video with the Kinect seems quite attractive. The Kinect provides a shortcut to working with some of the processes and techniques that were previously only available to high budget special effects movies: motion capture, 3D photography, integrating actors with digital sets, etc. While a small team working with the Kinect would produce results that are essentially glitchy unpolished versions of these techniques compared to the professional Hollywood version, those glitches would be a terrific match with Jeremiah’s aesthetic.

After a couple of weeks of pondering this prospect, I got an idea for what the video’s story should be. I thought back to the Giant’s Drink sequence from Orson Scott Card’s sci-fi masterpiece, Ender’s Game. In the novel, the Giant’s Drink is one level of a video game used to evaluate the psychological state of young children being trained as generals. It’s an impossible game where a giant offers the child two drinks and tell them to choose. Drinking either option causes the child’s avatar to die a horrible death. It’s a test to find out if they’re suicidal; do they return to the game over-frequently? Does their need to win extend past the rational? The main character eventually defeats the game by breaking the rules.

My concept was to have Jeremiah play both the child and giant. Since we’d be capturing his performance in 3D using the Kinect we could arbitrarily scale and render it within the 3D environment we create without a problem.

Also, I imagined adding an element not present in Card’s story: a disintegrating city through which Jeremiah has to run to reach the giant. Much of Jeremiah’s music is extremely intense and surrounding the atmosphere with a world in the process of tearing itself apart would create a fast moving chaotic visual surface to match: all flying building parts, shaking camera, glinting glass.

After coming up with this idea, I pitched it to Jeremiah and he agreed. He selected a song he’s working on for an upcoming album and I got to work. I started working in two basic directions: doing experiments with the visual techniques I planned to use and shaping the story more precisely.

On this first front, I came up with a rather clever way to do the disintegrating city: downloading 3D models of buildings from Google Warehouse and applying physics to them so that they fall apart. I was pleasantly surprised to find out how easy this was. Using Cinema 4D I loaded up a model, applied some basic dynamics, materials, and lighting, and very quickly had a test of the Empire State Building collapsing within a couple of hours’ work.

Another experiment I’ve been working on is going from captured Kinect data to functional 3D models that can be used in animation. So far I’ve only been experimenting with still images, but I’ve managed to create a mesh from the Kinect point cloud, clean it up with Meshlab so that it’s workable, edit it in Cinema 4D, and animate it in Open Frameworks.

I’m currently working on using skeleton detection with the Kinect to puppet 3D models, on recording depth data in order to play it back later as edited meshes, and a few other techniques.

I’ve also been collecting some visual references for what I want the video to look like in the end, but I’ll write-up a more extensive “mood board” post from those later.

The other big avenue of work I’ve been focusing on has been shaping the story of the video into something I can actually shoot. I started by writing a full ~1000 word treatment that expanded the concept I pitched to Jeremiah into a more complete story. I’m including the full text of the treatment at the bottom of this post.

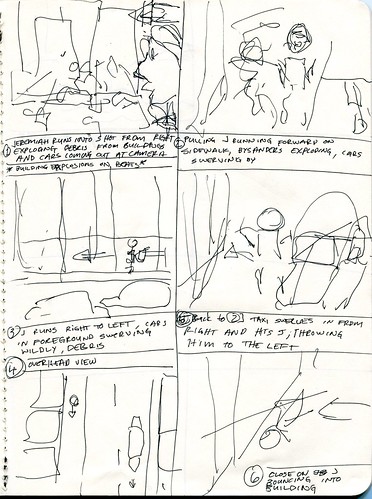
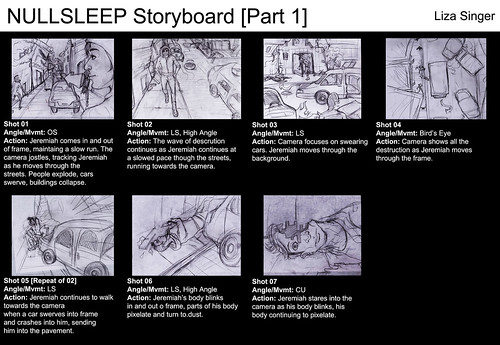
After writing that, I recruited Liza Singer, a fellow ITP student who also works as a storyboard artist to help me convert the treatment into a visual format. After some discussions, we established a process where I produce rough shot sketches which I then hand over to her (with extensive verbal explanation) and she then converts into legible storyboards.

For example here were my sketches for the first few shots of the video:

Shot 1-6 Storyboard

And her reinterpretation of the same:

Storyboard 1-7

In addition to this visual work, I’ve also been working on planning the timing of the story so that it fits the key moments of the song and working out a production schedule so the video will be completed by the summer date that Jeremiah’s set for release. I’ll write further updates here as the project progresses.

Here’s the treatment, as promised:

Jeremiah runs through a city falling to pieces. He dodges bits of falling buildings, exploding passersby. He gets hit by a car and thrown wildly to the side and into a building. He blinks in and out of reality then brushes himself off, stands up, and runs off again, barely dodging a large chunk of falling debris.
After a few more near misses, Jeremiah descends into a round plaza. As he reaches its center, the plaza begins rumbling. Pavement flies from its edges as it tears itself free from the surrounding street and rises into the sky. Jeremiah struggles to keep his balance as the dish-shaped plaza soars into the sky, a crumbling pillar of earth, layers of plumbing, and a torn-out segment of subway car emerging beneath it.
As the end of a shaky vertical climb brings it level with the surrounding skyscrapers, the saucer tower rumbles to a stop.
Jeremiah wheels around to see a giant approaching. The giant bellies up to the side of the plate. He stares directly at Jeremiah. His features are familiar, almost like a giant version of Jeremiah himself.
Jeremiah stands stock still.
The giant sets down two glasses in front of Jeremiah. They are giant-scale shot glasses, coming up to Jeremiah’s waist. The one on the left contains some kind of green liquid; the one on the right a pink liquid.
“Drink!” the giant bellows.
Jeremiah steps forwards hesitatingly. He looks at each of the glasses. The green one seems to be bubbling violently. Evil-looking smoke is issuing from its top. The pink one is the color of kid’s bubblegum. It coats the sides of the glass thickly.
“Drink!” the giant bellows again. “Or you’ll never get to Fairyland.”
Jeremiah looks up at the giant and then back at the drinks. A bubble pops from the surface of the green liquid, hissing and releasing a curl of smoke.
Jeremiah steps up to the other glass. He looks back up at the giant who is watching him intently. He tilts the huge glass forward and leans over to drink. The pink liquid oozes towards his mouth. When it finally reaches the lip of the glass he drinks a small sludgy sip.
Nothing happens.
Suddenly Jeremiah’s eyes get wide. Something is happening to him. His head starts to swell up like a balloon. He raises his hands to feel it expanding into a huge sphere.
His face stretches out across his head as it continues expanding. Now enormous, his head lifts him off the ground and his feet dangle helplessly. He looks up and sees the giant cackling madly.
With a loud POP his head explodes, fragments flying everywhere, and his body falls into a heap on the ground.
Everything fades to black.
Fade up from black on Jeremiah back where he started, running in the exploding city. Jeremiah runs frantically down a street with buildings collapsing into flying debris all around him. The same car that hit him before swerves up, but this time he’s ready, jumping over its hood at the last second and continuing down the street.
He passes the same sights as in the first pass — the falling Empire State Building, the exploding people — but this time he moves past them more smoothly and after a few familiar flashes he reaches the plate-like plaza again. This time he runs straight to its center and stands bracing himself, solidly keeping his footing as the plaza rumbles and rises into the air.
Again the plaza settles in level with the top of the surrounding skyscrapers and the giant approaches its lip. He slams down two more waist-high shot glasses, one filled with a glowing hazard-orange liquid, the other with what looks like miniature clouds firing off tiny lightning bolts.
“Drink!” the giant bellows.
Jeremiah steps cautiously forward and regards each of the drinks skeptically in turn.
He hesitates.
The giant draws his face in close above the glasses and bellows again: “Drink!” Or you’ll never get to Fairlyand!”
Jeremiah looks between the glasses again and then up at the giant. He starts to back away slowly.
“Drink!” the giant bellows again, bringing his face in even closer.
Jeremiah leans back and then hurls himself forwards, running towards the giant and the glasses. He leaps up onto the rim of one of the glasses and uses it to launch himself up towards the giant’s face. He lands on the giant’s cheek and clings on. The giant roars in anger and tilts his head back causing Jeremiah to lurch forward onto the giant’s lower eyelid.
He looks up at the eye, which swivels over trying to see him. Jeremiah starts digging into the eye with both hands, tearing out handfuls of eyestuff. The giant roars in agony and starts falling backwards. Jeremiah keeps digging as together they fall faster and faster toward the city below.
The giant comes crashing to the ground, shaking the earth and leveling the last of the city’s buildings. A cloud of dust rises around its fallen body.
Once the giant’s body has come to rest, Jeremiah is nowhere to be seen. After a beat he crawls out of the giant’s hollowed out eye hole. He climbs down off of the giant’s face and stumbles back a few paces.
As he watches the giant’s body begins to transform, its clothing turning into grass and rocks, its skin dissolving into mud and dirt. Its limbs become green hills stretching off into the distance. The dust clouds from its fall cohere into white puffy clouds floating away gently into a sky rapidly clearing into a pure blue.
Jeremiah scrambles back up onto the giant and looks around the landscape. He sees a road leading away down the giant’s neck towards its sternum and he heads over to it. At the start of the road is a sign pointing down it labeled “Fairyland.”
Jeremiah starts down the road. Soon the road passes into a dark wood, trees forming up in walls nearly to its edge. Glowing eyes poke out from between the trees. The sky is rapidly reddening into a bloody sunset.
One-by-one creatures begin emerging from the trees. They are grey wolves with human faces, all resembling Jeremiah’s own. They gradually surround Jeremiah in an ever tighter pack. He seems unconcerned, barely noticing them.
Jeremiah and the wolves head off down the road as the sun goes down and the landscape disappears into darkness.

Posted in Art | Leave a comment

Sound Scan: 3D scanner using falling BBs and sound

How can you make a 3d scan using sound? That’s the question that Eric Mika, Jeff Howard, Zeven Rodriguez, Molmol, and I set out to answer this week. Challenged by our 3D Scanning and Visualization class to invent our own scanning method, we decided to take the hard road: scanning using sound generated by physically hitting the object to be scanned. Obviously not a very practical approach, we liked the idea of a scanning method that’s something like physical sonar, involving actually touching the object in order to determine its shape.

We quickly sketched a plan to drop BBs from a known height onto an object. We’d drop individual pellets one at a time from known x-y positions in a grid. We’d detect the time of the BB’s fall using a photo interrupter and we’d use the sound of impact to detect the time the BB contacted the object. Eric came up with the brilliant idea of sending the photo interrupter signal as sound as well in order to get the sample rate up high enough to get reasonable accuracy and to make the hardware dead simple.

We got to building. We started off by building the interrupter.

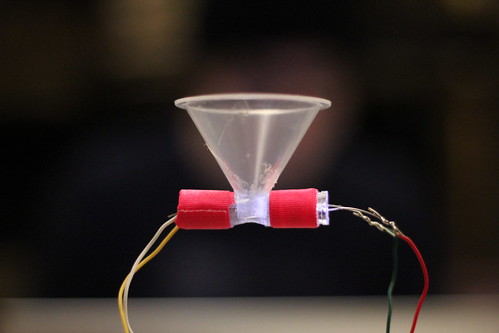
side view of ball funnel with light interrupter

We attached a bright LED and a photo resistor to opposite sides of a clear funnel. Then we connected the photo resistor to a power supply and a fixed comparative resistor along with a tap to send the output to the line-in of an audio mixer. The result was a tone that would drop radically in volume when something got between the LED and the resistor. We also hooked up a microphone to the same mixer and panned the two signals left and right. We then whipped up an Open Frameworks app to read the audio samples and separate them out. Now peak detection on each channel would tell us when the BB left the funnel and when it hit the target.

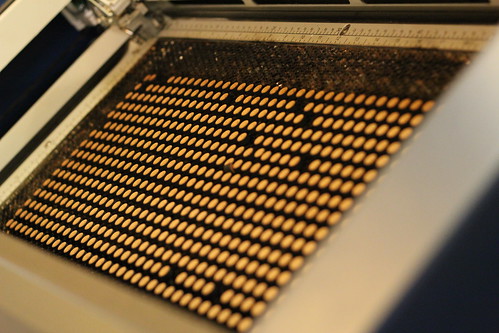
Simultaneously we got the laser started on cutting hundred of 1/4 inch circles out of a masonite board in a grid. These would act as x-y positioning holes, allowing us to render the corresponding depth measurements extracted from the sound apparatus into voxels. We conducted some basic tests dropping balls into plastic buckets and getting readings that seemed to be proportional with the distance of the fall.

Board holes left in the laser

Once we had these two things completed we were ready to conduct our first real test. We needed a small simple object to scan that wouldn’t require the use of hundreds of points to cover but still would reveal some kind of 3D shape. After some discussion, we decided to choose a simple bell. In addition to meeting our other criteria we thought the bell might make a nice dinging sound when pelted with BBs.

So, we got in position. Eric sat behind the Open Frameworks sketch and moved the cursor around the x-y grid, square by square, calling out positions to Jeff who matched them on the masonite board and dropped BBs. I was on camera and BB pickup duty. We recorded the resulting data into a CSV file and then brought it into Processing for visualization.

This image looks almost nothing like the round bell we scanned. First of all there are outliers. Large points separated from the main body of points that are clearly unrelated, others that spike wildly high above the main cluster, probably resulting from failure to pick up the impact correctly with the microphone. Second of all, the visualization actually represents the distance between the x-y grid and the bell rather than the shape of the bell itself. We’d initially recorded the fall times themselves as data rather than converting them into distance and subtracting them from a known height in order to match the shape of the object in question.

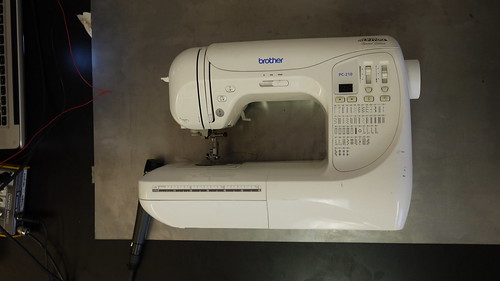
Now that the apparatus and process were working (albeit shakily), we agreed to make a second scan. We reconvened a couple of days later and chose a new object: a sewing machine.

3d sound scanner

We also affixed the masonite grid to a two-foot tall frame and built a base that would catch the flying BBs. For this scan we also committed to recording many more points, a 16 by 40 grid or 640 total points.

After a long period of ball dropping and measurement recording, a scan emerged. And, lo and behold, it looked actually something like a sewing machine.

Here’s a video of the whole process that shows the physical apparatus, the software interface we (mainly Eric) built in Open Frameworks showing the sound inputs as well as the incoming depth measurements, and an interactive browse of the final model (cleaned up and rendered in Processing).

And here’s a video of just the final model by itself, the curve of the top portion of the sewing machine pretty much clearly visible, kind of:

Sound Scan: 3D scanner using falling BBs and sound from Greg Borenstein on Vimeo.

While this scan may not be of the most useful quality, the process of building the hardware and software taught us a lot about the challenges that must be present in any 3D scanning process: the difficulty of calibration, eliminating outliers, scaling and processing the data, displaying it visually in a useful manner, etc.

Posted in Opinion | 1 Comment

Kinect Technical Drawings

For the first assignment for my Designing for Digital Fabrication class this semester, I just performed a series of precise measurements of the Kinect and used them to compose three drawings in Vectorworks. The purpose of the exercise was to learn the process of converting measurements into scale drawings and to get started in the process of learning Vectorworks. I’ve uploaded the drawings here as well in case they are of any use to anyone.

Posted in Opinion | Tagged | Leave a comment

Looking Up At The MJT

Last month, I participated in two sessions at the 2011 Modern Languages Association conference in Los Angeles. I was recruited by acquaintances associated with the MLA because of my relationship with David Wilson at the Museum of Jurassic Technology. Given the conference’s presence in LA, the MLA wanted to have David give a talk, but were having trouble getting ahold of him.

After some back and forth, we agreed that Craig Svonkin from the Metropolitan State College of Denver (the organizer of PAMLA at which I presented in 2009 on Project Cybersyn) and I would interview David on stage and that I would participate in a panel discussion afterwards with four other scholars.

David is a terrific speaker, but he’s usually quite cagey on the topic of the Museum itself and the motivations behind it, at least in public, preferring to discuss the content of individual exhibits — early 20th century Russian spaceship designers or micro-miniature sculptors. The idea of the interview format was to draw him out on that subject while making the experience less painfully confessional for him.

After much correspondence and an extensive trip to the Museum to talk with David in the days before the conference, Craig and I came up with a set of eight questions. We also left time for David to give a brief slide-based tour of the Museum, to add follow-ups on the fly, and to let the audience get in a few of their own. Unfortunately, the session wasn’t recorded, but I’m hoping to gather some notes taken by a few audience members and I’ll post those here when I get them. In the meantime, here were the questions Craig and I composed in advance:

1. CRAIG: Can you tell us a bit about your childhood experience of museums? Were there museums that you visited frequently or of which you have particularly strong memories? Why those?

2. GREG: For many lovers of the MJT, the qualities of light and sound within the museum are important to its aesthetic and emotional impact. You studied film at Cal Arts and worked in special effects and animation and much of your focus now is on making films. How does making the museum exhibits relate to filmmaking?

3. CRAIG. Can you describe how a single exhibit, such as Tell It To The Bees or Kircher, came about, from its inception to its completion?

4. GREG: It seems to me that the MJT has really transformed in the last ten years or so, perhaps focusing more of its exhibits around extraordinary people. Do you agree that the MJT has changed, and if so, how do you see this change?

5. CRAIG: Entering the MJT often feels like departing from the quotidian world outside, but much of the museum’s aesthetic seems to reflect the wider cultural values of Los Angeles. How has the museum’s immediate surroundings and neighborhood shaped it over time?

6. GREG: Having worked briefly at the museum, I know that there’s very much a family or community of people behind the scenes helping shape and execute your ideas. The museum is, in many ways, your home. Will you talk about how this domestic and social environment has shaped what the public sees at the museum?

7. CRAIG: Are there any ideas for exhibits that just didn’t pan out?

8. GREG: Mortality and decay seem to be repeating themes at the MJT. To broach an uncomfortable subject, have you thought about how the MJT might continue after you’re gone?

The session went really well. I think David felt comfortable talking directly to Craig and me and was able to, somewhat, forget the presence of the larger audience. Lots of people came up afterwards to say that it was a much more detailed and intimate look at the Museum than what they’d seen elsewhere.

After the conversation session was over, the panel began. Organized by Andrew Howe, the panel also included Kristen Koster, Jem Axelrod, Jeanne Scheper, and M. Catherine Coleman. Unlike the other scholars who gave theoretical, historical, and political interpretations of the MJT, I tried to present some close-observations of how the Museum uses light to create specific emotional and spatial effects. As an artist and visual person, I find that too much of the academic discussion of the Museum treats it as a “text” to be read rather than the profoundly visual, theatrical, and bodily experience that it is. Also, as someone close with the Museum staff I didn’t feel that I had the detachment or impartiality for straight interpretation. But, simultaneously, as someone who’s spent quite a lot of time in the Museum over the last ten years (as opposed to a few of the the panelists who had briefly visited for the first time during their trips to LA for the conference) I thought that my detailed observations might be able to inform the other interpretations, possibly even restraining some of their more theoretical flights of fancy.

I’ve included the slides from my presentation at the bottom of this post, they’re mostly pictures of the parts of the Museum above, around, and behind the exhibits: the clusters of lights and mirrors that illuminate the objects in the displays. Below, I’m also including a brief essay I wrote on returning to New York that tries to translate some of the visual experience of navigating the MJT into language.

White text glows with reflected golden light. Deep shadows rake angles across the text’s plexiglass panel, leaving its corners illegible. But its edges catch internal reflections and their incandescence seems to float the panel off the wall.

As you lean to look closer at the jawbone fragment the text explains, the darkness around you thickens. You’re blind besides this text, this bone. And the space of the museum behind you stretches out, other exhibits rushing away, footsteps and whispered chats muffled.

The warm light pinkens the bone of the jaw, but somehow leaves the teeth a pearlescent white. The cracks on the bone’s underside cast deep shadows and you only notice the black rod that floats it above its platform when you’re leaning over it, casting your own shadow.

This movement, this break in the light, feels so violent that you reel, turning to look over your shoulder for its source. You see instead the source of the light: two ordinary bulbs racked on a totally unromantic clutter of hardware and clamps in the room’s corner. They’re cobweb-covered and dusty. Beneath them you notice a gap between wall panels — a wound in the space — metallic tubing and sloppily splayed cable stuffed just behind.

You’ve never looked up before, when you’ve been here.

Until this moment your image of the place ended not far above your head, fading into unconsidered fuzziness. But now you’re really seeing it. The tops of false walls that don’t meet the ceiling end abruptly without molding. Apparatus bristles: lights in jury-rigged fixtures, cheap commercial speakers, even extension cords. A whole hidden Home Depot shelf’s worth of guts labors to produce the soft pools of light, the gentle encompassing blindness.

Slowly you turn back towards the jawbone to look again at the lights’ effects. This time you notice your eyes adjust, you see the bright light force your irises to clamp down against it, hiding the dimmer surroundings like the low glass case of pinned-butterflies off to the left.

As you settle in to look you realize that even though you’ve now seen how the trick is done, its effect remains undiminished. The box of warm light reflected up onto the text by the brass rectangle beneath it, the lushness of the red cloth covering the plinth, the rich shadow on the riser behind the bone, these things still stir an unnameable feeling triangulated between reverence, delight, and a deep melancholy.

After letting this feeling hold you a moment more you pull back and turn away, moving past the butterflies and on into the rapidly receding dark.

Looking Up at the MJT

Posted in Video Sculpture | Leave a comment

LO: October 29, 1969

On October 29, 1969, at 10:30pm grad students and professors at UCLA’s Network Management Center and Stanford’s Augmentation Research Center began the first ever test of the ARPANet, the initial incarnation of today’s Internet.

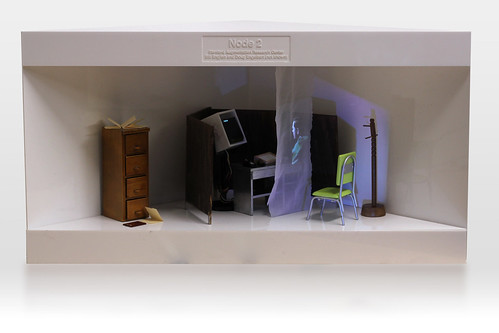
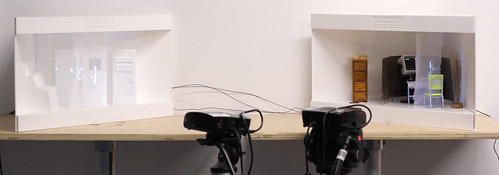
My sculpture, “LO: October 29, 1969”, memorializes this moment. It uses laser-cut plexiglass, OLED screens, dollhouse furniture, composited educational films, and Baroque theatrical lighting effects to reenact the birth of our now ubiquitous online world.

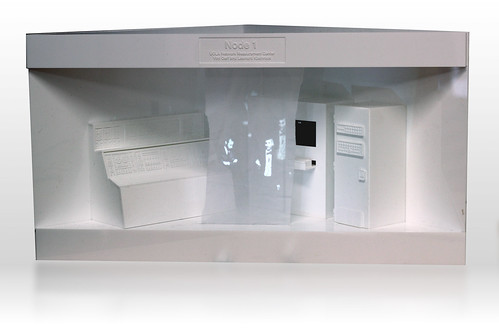
UCLA side

LO detail. Node 1: The UCLA Network Management Center

It was a modest moment, lacking ceremony, this first ARPANet transmission. The UCLA and Stanford teams connected their IMPs (Interface Message Processors) and the UCLA team begin the process of logging into Augment’s NLS collaboration system. The two teams were in phone contact with each other; as the UCLA team typed each letter of the initial login command (L – O – G – I – N), they verbally confirmed its arrival in the north.

Stanford Side

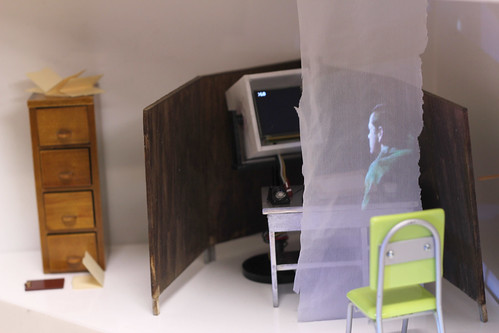
LO detail. Node 2: The Stanford Augmentation Research Center

However, something, as it always does in software tests, went wrong. When the UCLA team typed the “G”, the Augment system attempted to auto-complete the command to “LOGIN”, sending back too many characters down the ARPANet connection, causing the UCLA system to crash, which then brought down the Augment system in turn.

‘LO’: October 29, 1969 on Vimeo

This moment resonates with me as an origin narrative for a number of reasons. First, as a maker of interactive sculptures that rely on touchy, error-prone technology, I can identify closely with the bug that brought down the system on its first run. I’ve experienced exactly parallel problems in getting hardware projects to communicate with software. I find the presence of such a simple “beginner’s bug” at this epochal moment personally touching.

Secondly, and more importantly, the contrast between the cultures of the two labs on either side of this first Internet connection dramatizes a tension in technocultural development that persists and continues to shape our world today. Namely, the tension between the military industrial complex that funded the personal computing and networking technologies at the heart of our contemporary world and the counterculture which gave them their meaning.

Both the UCLA and Stanford labs received much of their funding from ARPA, the Defense Department’s Advanced Research Projects Agency. Though ARPA’s leadership interpreted its mandate broadly and creatively, their fundamental goals were oriented towards fighting and winning the Cold War. In fact because of this association computer technology was specifically picked out by anti-war protests as an avatar of the establishment’s warmongering. Punch cards were worn in anti-draft protests, students hoping to transfer their inscription of Do Not Fold, Bend, Mutilate or Spindle away from the cards and onto themselves.

However, by 1969 in the Bay Area around Stanford, the counterculture had strongly taken hold. And the Augment lab was not isolated from this change. Doug Engelbart, the lab’s visionary founder, and other of its lead engineers used LSD as part of their design process. The hippie encounter group EST was involved in the management of the lab. Leading countercultural figures, such as Stewart Brand and Ken Kesey, were frequent visitors.

Instead of seeing the computer as simply a tool of “The Man”, the Augment community began to imagine the computer as a consciousness expanding experience similar to other countercultural tools such as psychedelic drugs and communal living.

It is out of the synthesis of these two influences that the modern personal computer and internet cultures emerged: cutting-edge technology used towards the ends of advancing human communication, collaboration, creativity, and community. And it was at Doug Engelbart’s Augment lab that this synthesis first emerged. For the first time, rather than treating its users as information to be processed or cards to be punched, the Engelbart’s system imagined them as countercultural individual striving for expanded consciousness.

While the comparison is not entirely fair to the UCLA lab, LO attempts to emphasize this divide through the material in which each of the labs is rendered. The UCLA lab comes to represent the existing fully military industrial computing approach. That full side of the sculpture is manufactured out of laser-cut white plexiglass. Everything is clean, symmetrical, inhuman.

UCLA Detail

LO detail. The UCLA Network Management Center.

Further, for the figures in this half of the sculpture, I composited the heads of Vint Cerf and Lenard Kleinrock, two important figures in the creation of the ARPANet, onto a prmotional film from the 1960s explaining the technical workings of timesharing. The footage is black and white and the characters are dressed rather conservatively in suits, ties, and bow ties. I then projected that footage onto a scrim within the sculpture so the figures would appear to be floating within the scene, a technique derived from similar tricks used in Baroque theatre and magic lantern shows from the 18th and 19th centuries.

The Augment side of the sculpture, by contrast, is built of modified doll furniture and props as well as hand-fabricated pieces. It is messy, colorful, and lived-in. I based its appearance as closely as I could on actual photographs taken of the Augment lab in the 60s, archived on Henry Lowood’s terrific MouseSite.

Stanford Detail

The animation on this side, meant to represent Bill English, one of Engelbart’s chief assistants in charge of hardware, was extracted from a 1968 film imagining the different ways men and women will use technology in “the future”. It has the saturated color palette much associated with both that time and with psychedelic art of the period.

Here is a video of both half of the pieces together as installed at the 2010 ITP Winter Show. You can also hear me hoarsely explaining the piece to a visitor, articulating some of the ideas I have discussed here:

‘LO’: October 29, 1969 detail on Vimeo

To close, a few final technical notes on the piece’s execution. The two sculptures were designed to be halves of a square box. Inside of each one is an Arduino controlling the OLED screens in order to synchronize the display of the characters to represent the transmission of data from UCLA to stanford (see the first video I posted above). The OLED screens, while producing exactly the appearance that I wanted, turned out to be extremely fragile and expensive.

The Arduino in the UCLA side also communicated via USB with a Processing sketch that drove the videos projected onto both sculptures. Synchronization was achieved by having the Processing sketch send a serial message to the UCLA Arduino which would alter its OLED screen and then pass the message on to the Stanford Arduino, hence keeping the video and both of the sculptures in sync. Getting the Processing sketch to successfully play back both pieces of video without crashing was one of the most difficult technical obstacles in creating this project. And, in future installations, I will likely eliminate that component as the timing between the video and the OLED screens does not need to be as precise as I initially thought and using simple PICO projectors driven off of SD cards would allow me to eliminate the computer altogether, dramatically simplifying the setup and robustness of the project.

More photographs of the piece under construction (including details of all of the laser cut components) are available in the LO: October 29, 1969 flickr set.

I’ll be showing this piece beginning February 11 at Ventana244 Gallery in Williamsburg. More details about that show here.

Installation view at ITP Winter Show 2010

LO: October 29, 1969 installed at the 2010 NYU Winter Show

Posted in Art, thesis | Leave a comment

Single Pixel Camera

What is a camera?

In the broadest sense, cameras turn the light around them into an image. No matter if the camera is digital or analog, the appearance of that image is determined by the same set of factors: how much light is allowed into the camera, how sensitive the apparatus is, how the lens focuses the light, and how long the light is allowed to accumulate.

Most cameras, from the most expensive digital SLRs to homemade pinholes, cluster around the same range of values for these factors. They allow a small amount of light into a very sensitive sensitive sensor through sharp optics for a short amount of time.

But what if you chose a radically different set of values? For example, what if you made the camera incredibly insensitive, but then let it build up an image over an extremely long period of time to compensate? This is somewhat like what a pinhole camera does in comparison to a DSLR, but what if you went a lot further in that direction?

If you went far enough, you might hit the follow reducto ad absurdum: a camera with a single pixel that moves around step-by-step in order to form a full image.

Single Pixel Arduino Camera

I built this “camera” by attaching a TAOS light sensor to two servos. I programmed an Arduino to scan the servos in a grid pattern while reading the light value from the TAOS sensor at each point along the grid.

To my great surprise, the image formed is actually somewhat readable: you can start to see the side of the table and the floor that were in front of the apparatus. Because the image updates so slowly it ends up being a combination of the different things that happened to be in front of it at different times. Also, because the servos move the sensor in a kind a curved grid, the space of the image is highly non-square. Finally, since there’s only the most primitive lens on the sensor, the image has a soft quality despite its ultra-low resolution pixellation.

Obviously, this version of a Single Pixel Camera is extremely primitive (it was built in a single class period on the last day of last semester), but I think it’s an interesting topic with intriguing aesthetic possibilities that I’d like to explore further in the future. I’ve included the Arduino and processing code below if you’d like to experiment yourself.

Arduino firmware:

Processing sketch source:

Posted in Art | Leave a comment